A clear insight into your business performance will enable you to make timely adjustments to your business processes as soon as they become necessary. This is crucial to achieving your strategic business objectives and strengthening your company's competitive edge. To obtain the information you need to be able to control your business processes, you can use the key performance indicators (KPIs) in the Management Information module. First, you translate your strategic objectives into targets and you store these targets in KPIs. Then, you can compare the actual values with the target values.
For some companies it may be sufficient to record the number of productive hours per week, or the monthly costs and turnover. For other companies it is important to track information such as the number of orders won, the delivery reliability, and the service level. This type of management information will enable you to make the right decisions.
Comparing actual values with standard values
The Key performance indicators form shows the standard values, the actual values, and the differences between them. The standard values are the desired or expected values, budgets, etcetera, which are used as benchmarks when assessing the actual values. KPIs allow you to check whether the actual values are in line with the standard values.
Retrieving actual values
Actual values can be filled in either manually, or automatically using scripts. Scripts ensure faster and more accurate data entry. When working with highly variable values, such as the number of FTEs used during a particular period, it may be advisable, however, to enter the values manually.
Balanced Scorecard
To identify the drivers for your company's success, you could use 'Balanced Scorecards'. A Balanced Scorecard distinguishes various areas for business objectives with corresponding parameters. A set of KPIs makes up a Balanced Scorecard, which will therefore be different for each company.
Examples
Examples of KPIs you could create are:
Setting up KPIs
Once you have identified the most important indicators for the success of your company, you set up the KPIs, translating the indicators into KPIs in Isah.
Using pivot tables to clarify data
To make it even easier to compare the standard values with the actual values, you can use a pivot table to summarize the relevant data.
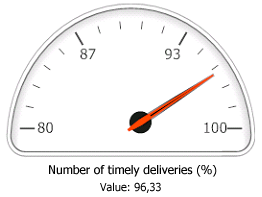
Displaying KPI graphs
KPIs can be displayed in graphic format on an HTML page. They show the actual values of the health indicators for your company. You can include the indicators on the right-hand side of the main menu, so you will see them as soon as you open Isah. You can also use them on the intranet or Internet.