An in-depth picture of your business enables you to make timely interventions in your business processes, if necessary. This is crucial to achieving your strategic business objectives and strengthening your company's competitive edge. To obtain the information you need to be able to adjust your business processes, you can use key performance indicators (KPIs) in the Management information module. First you translate your strategic objectives into targets that are defined in KPIs, and then you compare the actual values with these target values.
For some businesses it may be enough to record the number of productive hours per week, or the costs and turnover per month. Other businesses might want to track the number of orders won, measure the delivery reliability and service levels, and monitor other information. This type of management information will enable you to make informed decisions.
Comparing actual values with standard values
The Key performance indicators form lists the standard values, the realized values, and the differences between them. The standard values are the target (or expected) values, budgets and other figures that are used as the benchmarks for the actual values, so you can check whether the realized values are in line with the standard values.
Retrieving realized values
Realized values can be filled in manually, or automatically using scripts. Scripts ensure a faster and more accurate data entry, but manual entry may be advisable for values that can vary greatly, such as the number of FTEs used in a period.
Balanced Scorecards
To identify the drivers for the success of your business, you can use Balanced Scorecards. A Balanced Scorecard distinguishes various areas for business objectives with corresponding parameters. A set of KPIs makes up a Balanced Scorecard, which will be different for each business.
Examples
Examples of KPIs you could create include:
Setting up KPIs
After you have identified the key success indicators for your business, you can set up KPIs, which involves translating them into KPIs in Isah.
Using pivot tables to clarify data
To make it even easier to compare the standard values with the actual values, you can use a pivot table to summarize the relevant data.
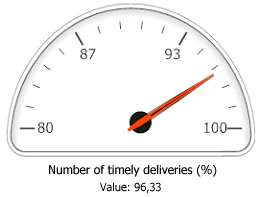
Displaying KPIs in graphs
You can choose to show your KPIs in a graph on an HTML page. This graph will show you the actual values for measures that indicate how your company is doing. You can add the indicators on the right-hand side of the main menu, so that you will see them as soon as you open Isah, or you can use them on your intranet or the Internet.