Showing data by period
To get the most out of a pivot table, you can add fields to the pivot table:
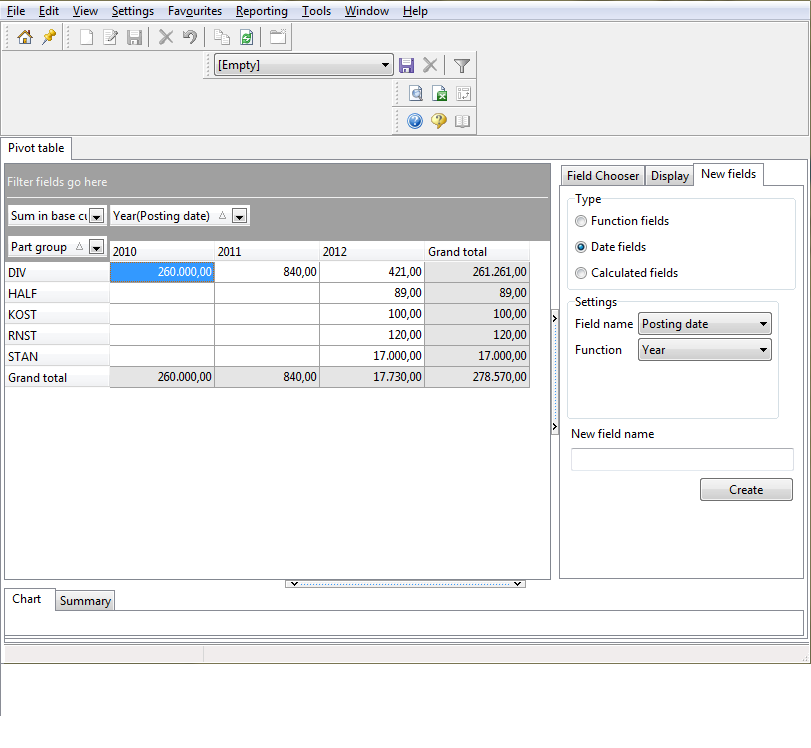
By default, data will be displayed by day, such as the order date or the invoice date. Often you will be more interested in period-specific data, however, such as the monthly turnover or the weekly production. For period-specific overviews, all sums and quantities for a specific period must be added up. The figure below shows the annual turnover by part group based on the posting date. Overviews like these will make it easy for you to compare the part group turnover data of several years.
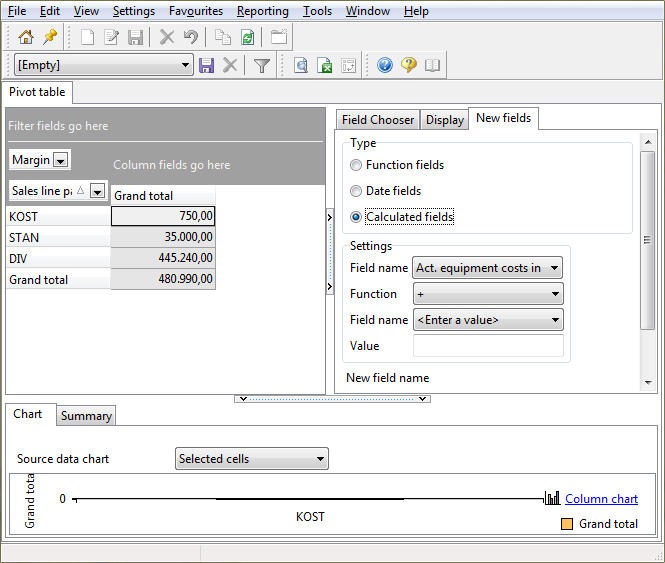
It is possible to perform calculations on fields containing numeric values, such as sums and quantities. The calculated values will be inserted into a new field. For example, if a form displays turnover and costs, but you would also like to see the margin, you can create a Margin field in the pivot table. The costs will then be deducted from the profit, and the result will be inserted into the new Margin field.
To add calculated data, follow these steps:
To view the calculation performed in the field information, right-click the calculated field and choose 'Field information'.
Performing statistical calculations
To simplify the interpretation of the data in a pivot table, you can perform statistical calculations on fields containing numeric values, such as sums and quantities. The calculated values will be inserted into a new field.
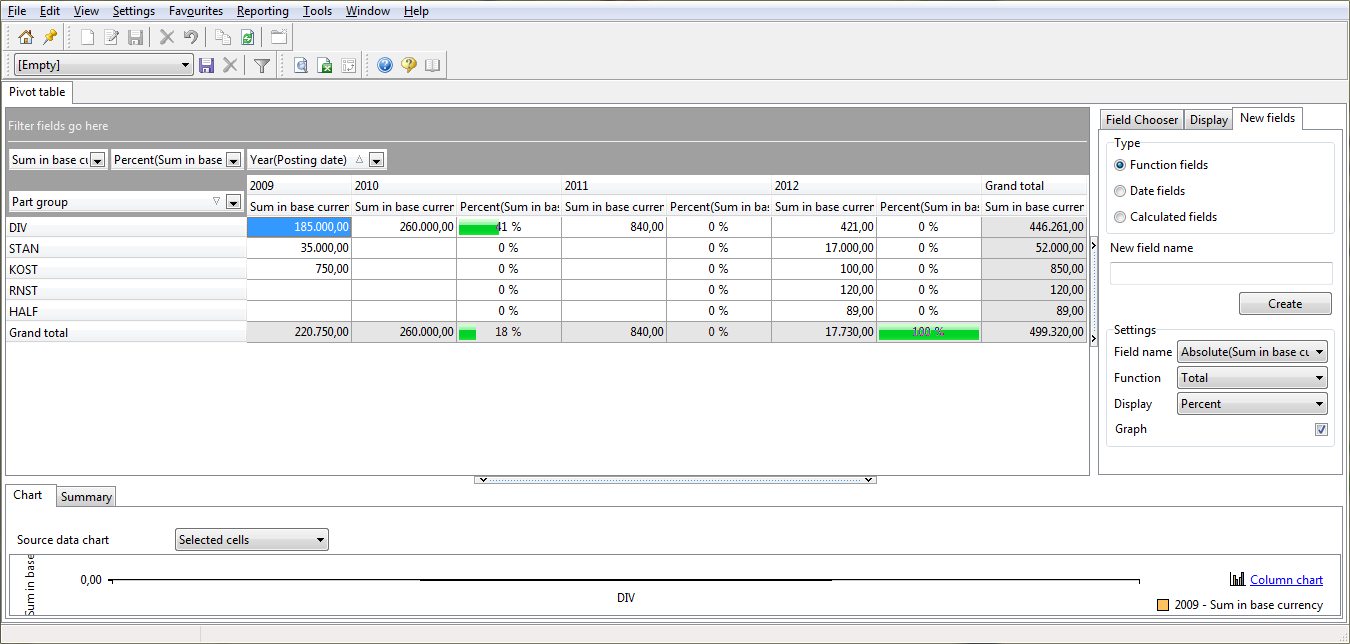
When choosing percentage differences, you can also choose to display them in graphic form. Select the Graph check box to display the percentage as a bar.
Statistical functions:
Statistical functions |
Description |
Quantity |
Shows the number of lines that have been added up to return the value. For example, for the 2008 turnover sum, the values of 30 lines have been added up. |
Total |
Adds up numeric values in a row or column, and displays the total. |
Min |
Shows the lowest value in a row or column. |
Max |
Shows the highest value in a row or column. |
Average |
Shows the average of the values in a row or column. |
StDef |
Shows the standard deviation. |
StDefP |
Shows the standard deviation of the entire population. |
Var |
Shows the variance. |
VarP |
Shows the variance of the entire population. |
Horizontal cumulative |
Adds up the sums in a row, and displays the total sum. |
Vertical cumulative |
Adds up the sums in a column, and displays the total sum. |
Display options for the Sum function:
Display options |
Description |
None |
Apart from the summation, no other information is shown. |
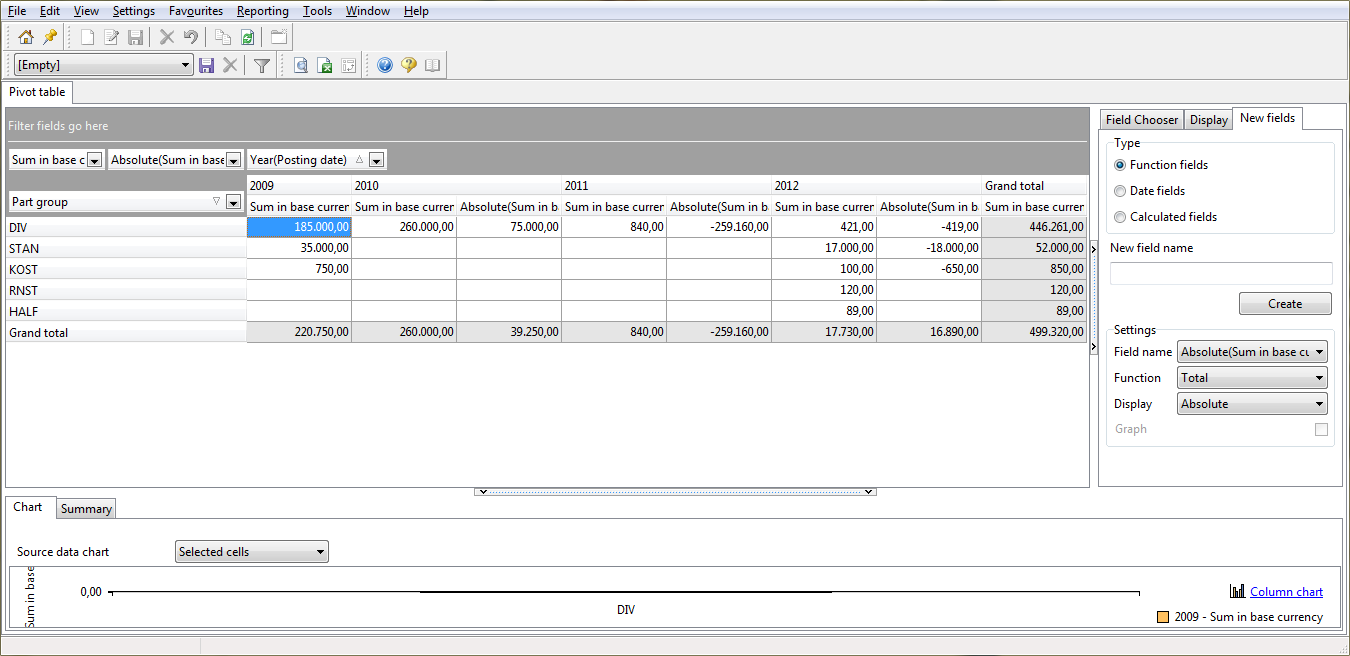
Absolute |
Displays the differences between the columns. The value of the first column is deducted from the value of the next column. Value of column Y - Value of column X = Absolute difference. |
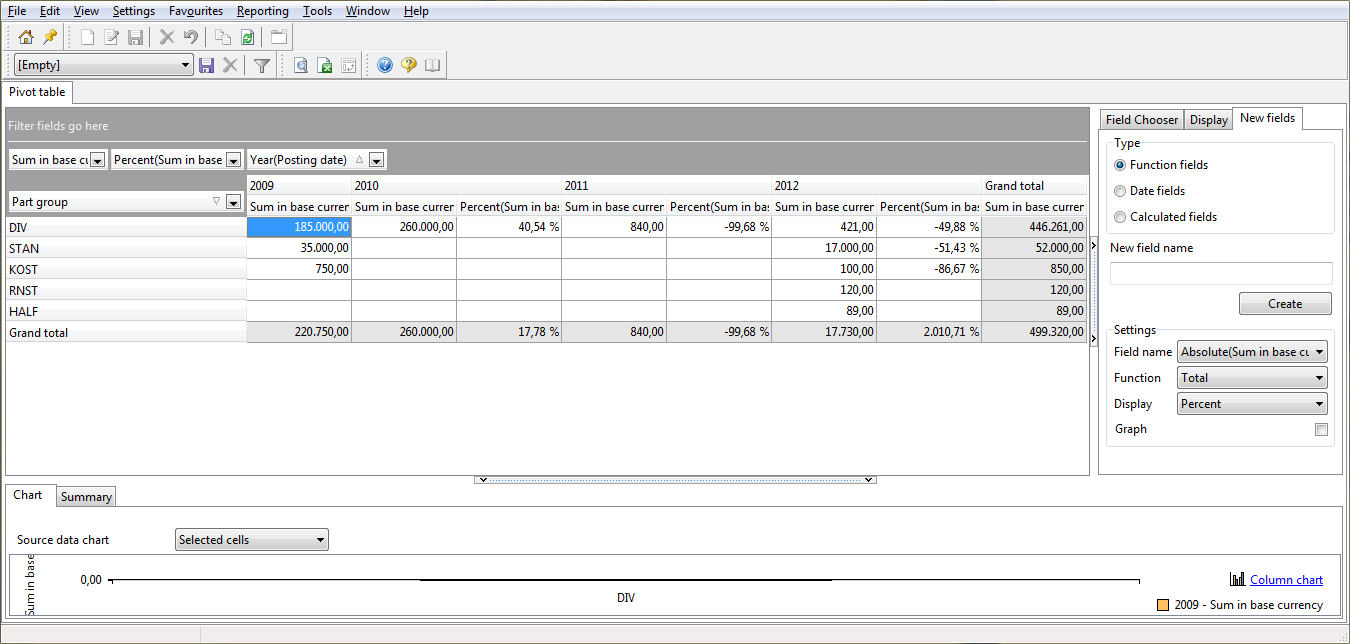
Percent |
Displays the percentage differences between the columns: (Value of column Y - Value of column X) / Value of column X * 100% = Percentage difference. |
Percent of column |
Displays the percentage differences between the columns: (Value of column Y - Value of column X) / Value of column X * 100% = Percentage difference. |
Percent of row |
Adds up the sums in a column, and displays the total sum. |