Use the Field Chooser tab to select the fields to use in the pivot table. The Field Chooser contains all of the fields that are available in the preset of the form from which you have opened the pivot table. If you open the pivot table from a report, the Field Chooser contains the report data.
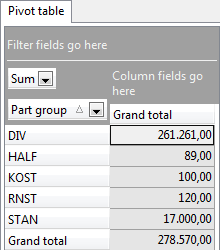
The data fields determine the values displayed in the table. For example, if you drag 'Sum' from the Field Chooser to the Data fields, the table will display sums. The Column and Row fields determine the type of sums, for instance the annual turnover sum by part group. It is usually an addition sum.
To leave certain data out of consideration, such as particular part groups that are irrelevant, click next to the relevant field and clear the check boxes. Make sure to select only the data you want.
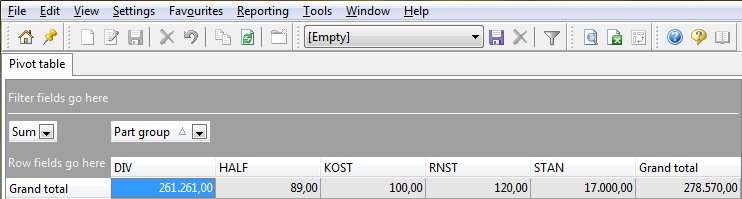
The column fields determine the columns in the table. For example, if you drag 'Part group' from the Field Chooser to the Column fields, the part groups will be displayed side by side in columns.
To leave certain data out of consideration, such as particular part groups that are irrelevant, click next to the relevant field and clear the check boxes. Make sure to select only the data you want.
The row fields determine the rows in the table. For example, if you drag 'Part group' from the Field Chooser to the Row fields, the part groups will be displayed underneath each other in rows.
To leave certain data out of consideration, such as particular part groups that are irrelevant, click next to the relevant field and clear the check boxes. Make sure to select only the data you want.
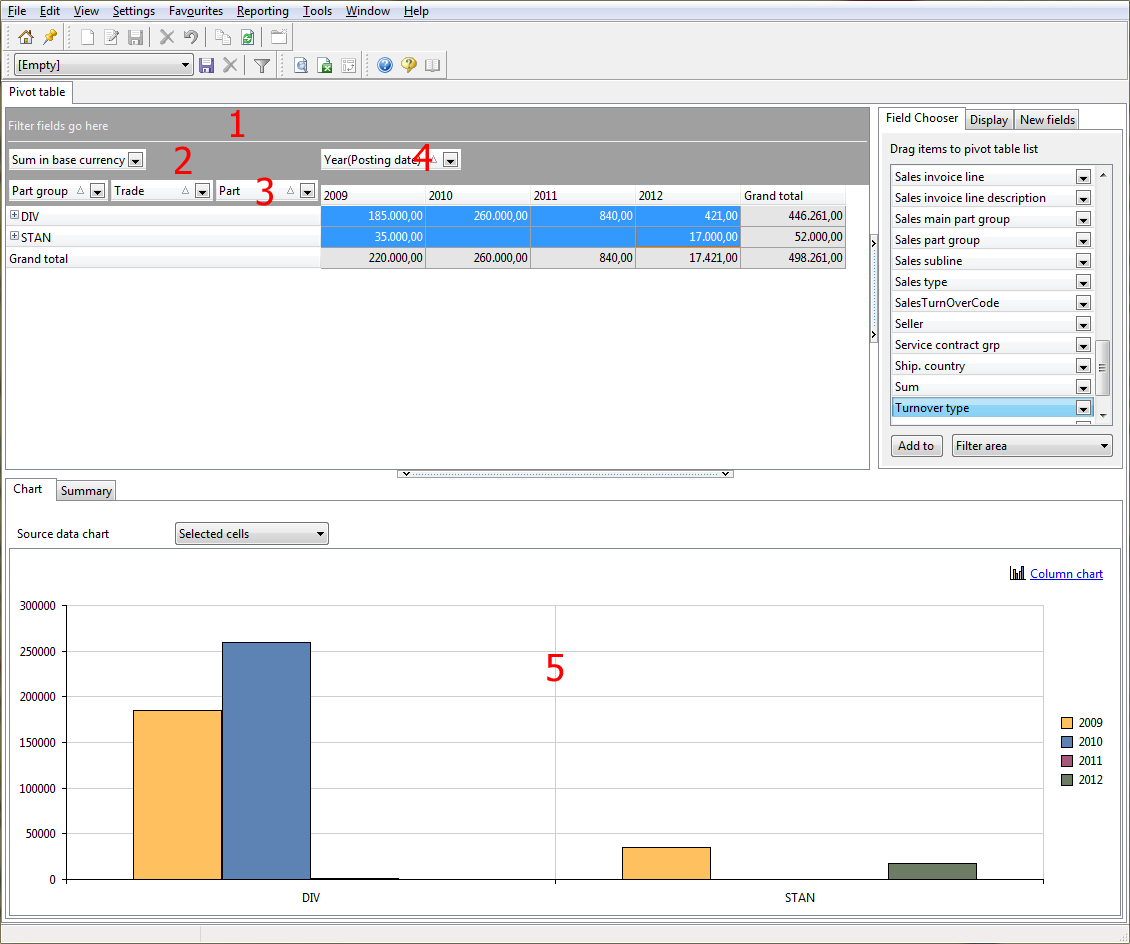
You can filter the data in the table by clicking the icon for the relevant data, column or row field. It is also possible, however, to filter data that have not been included in the table. From the Field Chooser, you can drag a field to the filter fields, such as 'Debtor name', to leave certain debtors out of consideration.
The filtering procedure is the same as for the data, column, and row fields. Click the icon next to the relevant filter fields, and clear the check boxes for the irrelevant data. Make sure to select only the data you want.
To make the table easier to read, you may need to deselect one or more of these elements. From the View menu, select Visibility elements to select the elements you want displayed in the table.
1:
Filter fields
2:
Data fields
3:
Row fields
4:
Column fields
5:
Chart
Using a filter
In a pivot table, you can specify the conditions the lines in the pivot table must meet, for example 'Town/city equals New York'. For more information see Using the AutoFilter.
 Field Chooser tab