If you open the Financial analysis form from the Sales offers or Sales orders form, the data on the form originate from the Create financial analysis of sales offers and orders process. If you have selected the Calculate financial analysis option from the Settings menu on the Sales offers or Sales orders form, this process will be executed again before the financial data are displayed. If this option is not selected, the results of the latest financial analysis calculations are displayed.
If you open the Financial analysis form from the Sales lines form, the data on the form originate from the Create financial analysis of sales offers and orders process. If you select the Calculate financial analysis option in the Settings menu on the Sales lines form, this process will be executed again before the financial data are displayed. If this option is not selected, the results of the latest financial analysis calculations are displayed.
If you open the Financial analysis form from the Sales offers and orders form, the data on the form originate from the Create financial analysis of sales offers and orders process. If you select the Calculate financial analysis option in the Settings menu on the Sales offers and orders form, this process will be executed again before the financial data are displayed. If this option is not selected, the results of the latest financial analysis calculations are displayed.
If you open the Financial analysis form from the Production files form, the data on the form originate from the Create financial analysis of sales offers and orders process. If you select the Calculate financial analysis option in the Settings menu on the Production Orders form, this process will be executed again before the financial data are displayed. If this option is not selected, the results of the latest financial analysis calculations are displayed.
If you open the Financial analysis form from the Projects form, the data on the form originate from the Calculate project line items process. If you select the Calculate financial analysis option in the Settings menu on the Projects form, this process will be executed again before the financial data are displayed. If this option is not selected, the results of the latest financial analysis calculations are displayed.
Note: On the Calculate project line items form, you can choose to recalculate the items of the linked sales offers and sales orders. If you select the Calculate financial analysis option from the Settings menu, however, the items of the linked sales offers and orders will always be calculated when you open the Financial analysis form from the Projects form.
To calculate the items of a sales offer or order, use the Create financial analysis of sales files process. For a project, use the Calculate project line items process. Projects often have underlying sales orders and production files, of which the items may already have been calculated. In that case, these data are collected and added to the project. You can also choose to calculate the items of all underlying files from within a project, so that the entire structure will be filled again. The exact items calculated depend on the data you enter on the processing form and the underlying structures.
To have the data recalculated each time you open the Financial analysis form, open the Settings menu and select the Calculate financial analysis option. This option is available on all forms from which you can display the financial analysis. This means that they can be set individually, as sometimes you may want to have a relatively simple calculation (for an underlying production file, for example) to be performed automatically, but you do not want the items of the entire project to be calculated, because that would be too time-consuming. Such major calculations would best be executed with a batch process running overnight.
Form layout
Use the fields of the left-hand side of the form to select the data to be displayed. Click the Get data button to refresh the data. As with all list forms in Isah, you can choose which columns you want to be displayed. To configure the columns, use the column chooser in the top-left corner of the form. You can also reorder the columns to suit your needs.
The columns on the right-hand side of the form are grouped by function. The more general data are followed by the preliminary costing data, the actual costing data, the quantities, the times, the revenues and the sales order reservations.
In the preliminary and actual costing columns, variable, fixed and commercial costs and contributions are listed separately. The revenues include the sales sums, the invoiced sums, the periods to be invoiced, and the invoiced periods. The quantities are the quantities specified on the calculation lines; the unit can be found in a separate column. The times are broken down into machine hours, labor hours and total time (labor and machine hours together).
If you view the Financial analysis form from a sales offer or sales order perspective, the type indicates the type of line. If you open the form from the Projects module, however, this column shows the item the project line is linked to (for instance, a periodic invoice line or a purchase line of a part).
If the calculation line has a purchase order linked to it, the commitments from the purchase order line are copied. This is the sum of the purchase lines against which you have not registered any receipts yet.
The expected costs are '0' if the calculation line has been finalized or if the actual costs have exceeded the preliminary costs. Otherwise, the expected costs are calculated as follows:
(Preliminary fixed costs + Preliminary variable costs + Contributions) - Total actual costs including contributions.
If the operation line has been finalized, the forecast figures will be equal to the actual costing figures. As long as the line has not yet been finalized, the following applies:
If the preliminary costing figures are higher than the actual costing figures, the preliminary costing figures will be used.
If the actual costing figures are higher than the preliminary costing figures, the actual costing figures will be used.
The Sales sums column shows the total sales sum of the sales lines, including any discounts. The Invoiced column shows the sums for which sales invoices have been created in Isah.
The Period revenue column shows the sums from the Periodic invoices form. Once the periodic invoices have been invoiced, the results are displayed in the Actual period turnover column.
These are the quantities from the part calculation lines, equipment lines, and external operation lines. The Unit column shows the unit of the corresponding calculation lines.
The expected quantities are '0' if the calculation line has been finalized or if the actual costs have exceeded the preliminary quantities. Otherwise, the expected quantities are calculated as follows:
If the operation line has been finalized, the forecast figures will be equal to the actual costing figures. As long as the line has not yet been finalized, the following applies:
If the preliminary costing figures are higher than the actual costing figures, the preliminary costing figures will be used.
If the actual costing figures are higher than the preliminary costing figures, the actual costing figures will be used.
These are the times of the operation lines in hundredths. Machine hours, labor hours and total hours (labor and machine hours together) are shown separately.
The expected times are '0' if the operation line has been finalized or if the actual costs have exceeded the preliminary times. Otherwise, the expected times are calculated as follows:
If the operation line has been finalized, the forecast figures will be equal to the actual costing figures. As long as the line has not yet been finalized, the following applies:
If the preliminary costing figures are higher than the actual costing figures, the preliminary costing figures will be used.
If the actual costing figures are higher than the preliminary costing figures, the actual costing figures will be used.
The Costs provision, Provisional turnover and Provisional WIP columns show the sales order reservations for the relevant sales orders.
Display
On the Financial analysis form, use the Settings menu to choose a flat display structure or a hierarchical display structure. The different views available for the Financial analysis form are best explained by using an example.
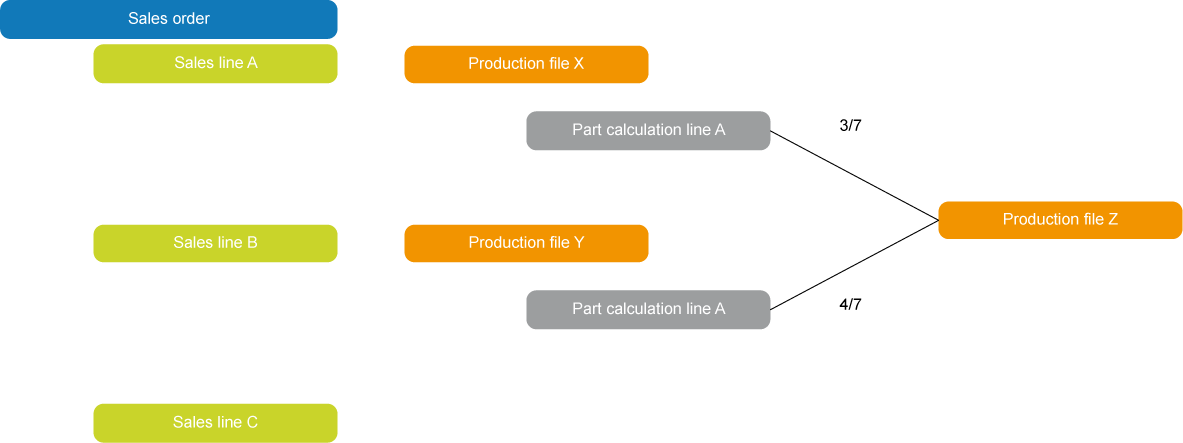
Let us assume that a sales order is built up in the following way:
The part on sales line A is produced in production file X; the part on sales line B is produced in production file Y. On part calculation line A, the same semi-finished product is required for both files. This product is produced in production file Z. Three of the semi-finished products will be used for the part calculation line of production file X; the other four will be used for the part calculation line of production file Y.
These data are presented as follows (any lines between parentheses are not shown in the above schema, but are inserted if they are present in a production structure):
Flat structure
Hierarchical structure
Sales order
Sales order
(Periodic invoice lines)
(Periodic invoice lines)
Sales line A
Sales line A
Sales line B
Production file X
Sales line C
Part calculation line A
Production file X
(Other part calculation lines)
Part calculation line A
(Operation calculation lines)
(Other part calculation lines)
(Equipment calculation lines)
(Operation calculation lines)
(External operation calculation lines)
(Equipment calculation lines)
Production file Z
3/7
(External operation calculation lines)
(Part calculation lines)
3/7
Production file Y
(Operation calculation lines)
3/7
Part calculation line A
(Equipment calculation lines)
3/7
(Other part calculation lines)
(External operation calculation lines)
3/7
(Operation calculation lines)
Sales line B
(Equipment calculation lines)
Production file Y
(External operation calculation lines)
Part calculation line A
Production file Z
(Other part calculation lines)
(Part calculation lines)
(Operation calculation lines)
(Operation calculation lines)
(Equipment calculation lines)
(Equipment calculation lines)
(External operation calculation lines)
(External operation calculation lines)
Production file Z
4/7
(Part calculation lines)
4/7
(Operation calculation lines)
4/7
(Equipment calculation lines)
4/7
(External operation calculation lines)
4/7
Sales line C
In the flat structure, all data are displayed underneath one another. There is no distinction between items on a higher level (such as sales lines) and the underlying items (the production files for a sales line). This means that you cannot see their interdependencies.
The hierarchical structure shows the underlying components as branches immediately below their parent levels. For example, you will see production files underneath the sales line they are associated with.
 From the 0033 Sales offers or 0070 Sales orders form